

Charting Your Course: The Foundation of Technical Analysis
The world of financial trading often appears to be a chaotic realm governed by unpredictable news and sheer guesswork. Many beginners believe that success is purely a matter of luck in the markets. However, a significant portion of the professional trading community relies on Technical Analysis (TA) instead.
TA shifts the focus away from a company’s financial statements or macroeconomic data. It operates on the core principle that all current and future information is already reflected in the asset’s price and trading volume. By studying this historical price action, traders identify patterns and trends.
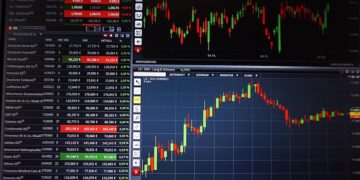
At the heart of modern technical analysis lies the highly effective candlestick chart. This method originated in 18th-century Japan to track rice prices. A single candlestick provides a wealth of market information at a quick glance.
It summarizes four critical data points for a specific time period: the opening price, the closing price, the high price, and the low price. Mastering these visual tools and recognizing recurring patterns is absolutely essential. This skill allows a trader to gauge the ongoing battle between buyers (bulls) and sellers (bears).
Deconstructing the Candlestick
To successfully master technical analysis, a trader must first understand the four crucial components that define every single candlestick. Each element tells a specific, detailed story about market activity during the defined time frame.
A. The Anatomy of a Single Candlestick
A standard candlestick is composed of two primary parts: the thick Real Body and the thin Shadows (or wicks). The color and length of the body are the most direct indicators of current market sentiment.
A. The Real Body: This is the thick rectangular section of the candle. It represents the specific range between the opening price and the closing price for that particular period. The overall length of the body reflects the intensity of the buying or selling pressure that occurred.
B. Body Color (Green/Red): The candle’s color indicates the direction of the recent price movement. A green body signifies a bullish period, meaning the closing price was higher than the opening price. A red body signifies a bearishperiod, where the closing price was lower than the opening price.
C. The Upper Shadow (Wick): This thin line extends vertically from the top of the real body. It marks the absolute highest price point reached during the trading period. A long upper wick suggests that buyers tried to push the price higher but were ultimately rejected by selling pressure before the close.
D. The Lower Shadow (Wick): This thin line extends vertically from the bottom of the real body. It marks the absolute lowest price point reached during the trading period. A long lower wick suggests sellers tried to push the price lower but were met with strong buying support that pushed the price back up before the final close.
B. Interpreting Basic Candle Shapes
The overall appearance and shape of a candlestick provides immediate insights into the prevailing market psychology. Short bodies and long shadows often signal market indecision, while long bodies signal clear dominance by one side.
A. Long Bullish Candle: A long green body with small or nonexistent shadows signals very strong, sustained buying pressure. Buyers were clearly dominant, pushing the price up substantially from open to close. This shape suggests a high probability of continuation of the upward trend.
B. Long Bearish Candle: A long red body with small or nonexistent shadows signals very strong, sustained selling pressure. Sellers clearly dominated, pushing the price down significantly from open to close. This shape suggests a strong continuation of the current downward trend.
C. Doji (Indecision): A Doji has a very small or completely nonexistent real body, meaning the opening and closing prices were nearly the same value. A Doji is the classic, strong sign of market indecision and a potential shift in momentum. This shows neither buyers nor sellers could take lasting control during the period.
D. Marubozu (Dominance): A Marubozu is a candlestick with a long body and no shadows (wicks) whatsoever. A green Marubozu means buyers held total control from the absolute lowest price (open) to the absolute highest price (close). It signals extreme, sustained dominance by one side.
Recognizing Key Reversal Patterns
The single most powerful application of candlesticks is identifying reversal patterns. These specific formations typically occur after a prolonged trend and signal that the current direction of the price action is very likely to change soon.
A. Bullish Reversal Patterns (Bottoming Signals)
These patterns usually appear at the very end of a downtrend, signaling that sellers are exhausted. Buyers are stepping in aggressively to quickly take definitive control.
A. Hammer: This is a small real body (red or green) at the top of a very long lower shadow, found after a downtrend. It signals that sellers initially pushed the price down sharply, but strong buying immediately reversed the move, closing near the open. It suggests that a potential bottom may be securely in place.
B. Inverted Hammer: This pattern is similar to the Hammer, but the long shadow is at the top end instead. The small body is located at the low end of the entire range. It suggests buyers initially attempted a powerful rally, but selling brought the price back down, yet the price still successfully closed higher than the previous low point.
C. Bullish Engulfing: This is a two-candle pattern occurring after a downtrend. A small red body is immediately followed by a much larger green body that completely engulfs the first red body. This signals that massive buying volume has successfully overpowered and dramatically reversed the selling pressure from the previous period.
D. Morning Star: This is a comprehensive three-candle bullish pattern appearing after a prolonged downtrend. It starts with a large red candle, followed by a small-bodied candle (the star), and then finishes with a final large green candle. It signals a definitive, strong shift from clear bearish dominance to firm bullish control over the three-period sequence.
B. Bearish Reversal Patterns (Topping Signals)
These patterns typically appear at the peak of an uptrend, indicating that buyers are rapidly losing their strong upward momentum. Sellers are beginning to take firm, aggressive control of the market price direction.
A. Hanging Man: This is the direct bearish counterpart to the Hammer, appearing after an uptrend. It has a small real body (red or green) and a very long lower shadow. It signals that intense selling pressure briefly appeared but was only temporarily overcome by buyers.
B. Shooting Star: This is the direct bearish counterpart to the Inverted Hammer, appearing after an uptrend. It has a small real body located at the bottom of a very long upper shadow. It signals buyers aggressively pushed the price up, but sellers immediately rejected the new high, forcing the price back down sharply near the open.
C. Bearish Engulfing: This is a two-candle pattern occurring at the top of an uptrend. A small green body is immediately followed by a much larger red body that completely engulfs the green one. This signals that massive selling volume has definitively overwhelmed the buying pressure, strongly suggesting a sharp reversal downwards is imminent.
D. Evening Star: This is a comprehensive three-candle bearish pattern appearing after an established uptrend. It starts with a large green candle, followed by a small-bodied candle (the star), and then finishes with a final large red candle. It signals a conclusive shift from bullish dominance to clear, sustained bearish control in the short term.
Identifying Continuation Patterns

While sharp reversal patterns naturally tend to grab the most attention, continuation patterns are equally important for a disciplined trader. These specific formations suggest that, following a brief pause or period of consolidation, the existing trend is highly likely to resume its original direction.
A. The Importance of Pause and Consolidation
A market does not move in a perfect straight line; it must breathe, pause, and actively consolidate momentum. Continuation patterns clearly show that this pause is merely a temporary break before the original strong trend continues its path forward.
A. Marubozu Continuation: A long green Marubozu immediately followed by a slightly smaller green Marubozu signals that the strong, underlying buying pressure continues uninterrupted by major selling. This is a very powerful signal of trend health and continuation.
B. Small Bodies and Wicks: During a confirmed uptrend, a few days of small-bodied, short-wicked candles often indicate minor profit-taking or a temporary market rest period. As long as these candles do not breach key support levels, the original trend is considered intact and likely to continue.
C. High Volume during Trend: Continuation is often powerfully confirmed by observing the accompanying trading volume on the chart. If the volume remains consistently high during the candles moving in the direction of the trend, it strongly supports the idea that the underlying momentum is still robust and continuing.
B. Specific Continuation Formations
Two specific continuation formations often indicate a brief period of indecision before the dominant trend successfully reasserts itself. These patterns often give disciplined traders a second chance to enter the existing strong trend position.
A. Rising Three Methods (Bullish): This is a five-candle pattern in an uptrend. It begins with a long green candle, followed by three small red candles (which must stay completely within the range of the first green candle), and concludes with a final large green candle. It signals that the pause was weak and the bulls have returned forcefully to continue the trend.
B. Falling Three Methods (Bearish): This is the five-candle bearish counterpart that occurs in a downtrend. It begins with a long red candle, followed by three small green candles (which must stay completely within the range of the first red candle), and concludes with a final large red candle. It signals that the minor counter-rally was easily defeated by the dominant bears.
C. Tasuki Gap (Bullish/Bearish): This specific pattern involves an initial price gap. A bullish Tasuki Gap sees two strong green candles separated by a price gap, with a third red candle partially filling the gap but importantly not fully closing it. This suggests the upward momentum is simply too strong for the sellers to completely reverse the initial gap.
The Context is Everything – Using Candlesticks Effectively
Candlestick patterns are highly effective visual tools, but they should never be used in complete isolation for trade decisions. They must always be interpreted within the critical context of the larger chart, existing trends, and combined with other reliable technical indicators for the best trading signals.
A. Integrating with Support and Resistance
The precise location where a specific candlestick pattern forms on the chart is far more important than the pattern itself alone. Patterns are most financially meaningful when they occur near critical price levels like historical support or resistance zones.
A. Resistance Confirmation: A Bearish Engulfing pattern that forms precisely at a well-established long-term resistance level is a high-probability, high-confidence sell signal. The resistance acts as a structural point of failure for the prior uptrend.
B. Support Confirmation: A Hammer or Morning Star pattern that forms directly on a major historical support level is a high-probability, high-confidence buy signal. The support acts as the reliable structural foundation that confirms the renewed strength of the buyers.
C. Trend Line Breaks: A pattern’s overall significance is strongly amplified when it coincides with the distinct break of a long-standing trend line. For instance, a long red Marubozu that breaks a diagonal uptrend line confirms that the overall bullish momentum is decisively over for now.
B. The Role of Timeframes and Volume
A candlestick pattern’s reliability increases dramatically when it is observed on longer timeframes and is strongly confirmed by the trading volume that specifically accompanies its formation.
A. Higher Timeframe Priority: A Bearish Engulfing pattern appearing on a daily chart carries significantly more weight and reliability than the exact same pattern appearing on a quick five-minute chart. Traders should always prioritize the primary signals from weekly and daily charts for overall trend direction.
B. Volume Confirmation: All powerful reversal patterns, especially the Engulfing patterns, must be strongly confirmed by high trading volume. High volume on the reversal candle validates that a very large number of market participants actively participated in the shift.
C. The Multi-Timeframe Approach: Professional traders always look for alignment across different timeframes. For example, they may only take a bullish trade on the 1-hour chart if the daily chart is also consistently showing a bullish continuation pattern.
C. Advanced Pattern Context (Risk Management)
The primary goal of accurately reading candlesticks is not just to find potential entry points, but critically, to clearly define the total risk. The precise structure of the pattern itself provides natural, clear places to immediately set stop-loss orders.
A. Stop-Loss Placement (Bullish): When entering a long position based on a Hammer or Morning Star pattern, the ideal place to set the stop-loss order is just below the lowest low of the entire reversal pattern’s formation. A move below this low immediately invalidates the pattern’s bullish signal.
B. Stop-Loss Placement (Bearish): When entering a short position based on a Shooting Star or Evening Star pattern, the ideal place to set the stop-loss order is just above the highest high of the entire reversal pattern’s formation. A move above this high immediately invalidates the pattern’s bearish signal.
C. The Risk/Reward Ratio: Candlesticks, by clearly defining entry and stop-loss levels, allow the disciplined trader to precisely calculate their risk/reward ratio before entering the trade. A highly favorable ratio (e.g., 1:2 or better) is absolutely essential for long-term profitability and sustainable trading success.
Conclusion

Mastering candlestick patterns is the absolutely essential first step toward achieving genuine success in technical analysis.
Each individual candle effectively tells a concise, complete story about the ongoing battle between determined buyers and aggressive sellers during a specific time period.
Understanding the real body and the shadows allows you to accurately gauge market psychology and the intensity of recent price movement.
Recognizing the key reversal formations, such as the Hammer and the Engulfing patterns, provides high-probability signals of impending trend changes.
However, these patterns should never be viewed in complete isolation from the broader existing market context or structure.
Their reliability increases dramatically when they appear precisely at established support and resistance levels on higher timeframes.
This technical proficiency with these crucial visual tools allows disciplined traders to clearly define their risk.
This disciplined approach transforms trading from unpredictable speculation into a high-probability, data-driven strategy for achieving long-term financial success.


